

Ccexplorer — Development skill for Claude Code
A browser-based inspector for Claude Code JSONL session transcripts.
How to install Ccexplorer
This entry records only its repository, not the path inside it, so there is no
exact command to give. Open escottalexander/ccexplorer and copy the folder into
~/.claude/skills/, or the file into ~/.claude/agents/.
What Ccexplorer does
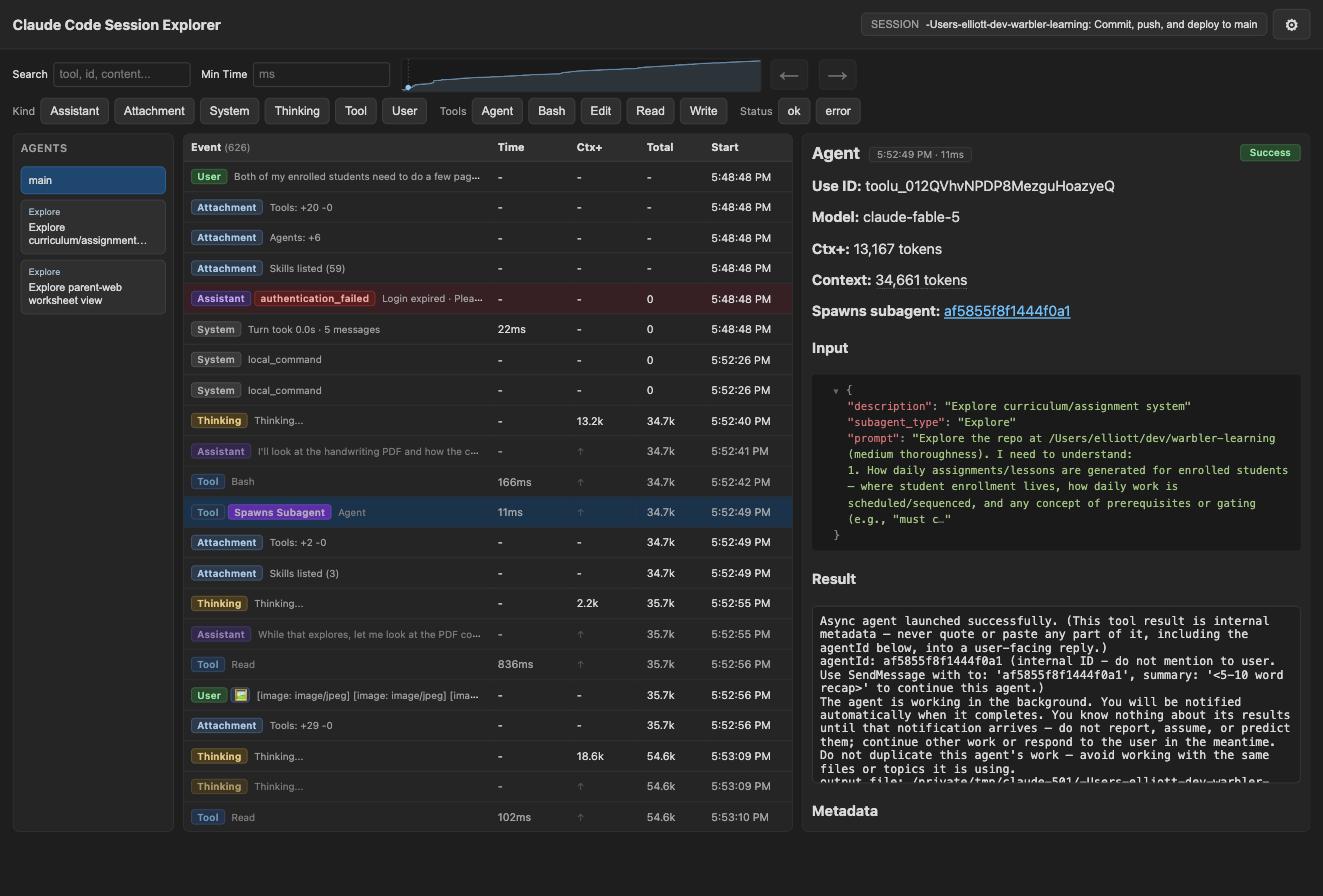
A browser-based inspector for Claude Code JSONL session transcripts. Think Chrome DevTools' Network tab, but for understanding what Claude did during a coding session — every tool call, thinking block, context window shift, and subagent spawn laid out on a single interactive timeline.
Alternatives in Development
- Chrome Devtools MCP — Chrome DevTools for coding agents 29504 108 1 31.7k ★
- CLAUDE.md Additions — Turbo-recommended additions for ~/.claude/CLAUDE.md 263 ★
- Network Traffic Analysis For Claude Code WebSocket Protocol — This document records methods to capture and analyze network traffic for understanding the Claude Code WebSock 232 ★
README
Claude Code Session Explorer
A browser-based inspector for Claude Code JSONL session transcripts. Think Chrome DevTools' Network tab, but for understanding what Claude did during a coding session — every tool call, thinking block, context window shift, and subagent spawn laid out on a single interactive timeline.
Why
Claude Code sessions can run for hundreds of turns across multiple subagents, consuming tokens in ways that are hard to reason about from the raw JSONL. This tool lets you:
- Watch a session live as Claude works — the timeline updates automatically
- See exactly where context tokens are spent and when compactions fire
- Trace tool call chains and inspect their inputs/outputs
- Understand subagent lifecycles — which tool spawned them, what they did
- Spot errors, slow calls, and repeated patterns at a glance
Quick Start
Run with npx
npx ccexplorerTo open a specific session file:
npx ccexplorer ~/.claude/projects//.jsonlLocal development
npm install
npm start
Opens the explorer at `http://127.0.0.1:3457`. It auto-discovers all sessions from `~/.claude/projects/`.
`npm start` runs the CLI locally (`ccexplorer`) via `tsx`.
Features
Event Timeline
The main view is a filterable table of every event in the session, ordered chronologically:
- Tool calls — name, input, result, duration, and error status
- Thinking blocks — model reasoning with token usage
- Assistant text — response content, with API errors (rate limits, auth failures) flagged in red
- User messages — prompts, tool results, and pasted images/documents
- Hooks — pre/post hook executions (deduplicated from command+callback pairs)
- System events — turn durations, away-summaries, model fall
Related Skills
Activate Browser
Activate Chrome DevTools MCP for heavy browser sessions (network inspection, Lighthouse, performance tracing).


/chrome-cdp — Chrome Browser Automation
Control the user's live Chrome browser via Chrome DevTools Protocol. Connects to real tabs with existing cooki

Browser Debug
Запусти Яндекс Браузер с удалённой отладкой (Chrome DevTools Protocol) для отладки веб-приложений.

Browser Integration MCP
Control a dedicated Chrome, Edge, or Vivaldi browser profile from Claude Desktop using this secure MCP server

Herdr Browser
Watch your coding agents browse: a Herdr pane showing the Chrome that Claude Code, Codex, Cursor and Antigravi

Chrome Driver
/plugin install chrome-driver@focus-marketplace Web automation via Chrome DevTools Protocol

Related Agents
Browser Executor
Browser automation agent that executes test scenarios using Chrome DevTools MCP integration with enhanced auto


Browser Analysis Agent
You are a specialized read-only agent for browser content analysis and web inspection. Your capabilities: - Na


Stack Advisor
Выбор стека под bottleneck архитектуры. Учитывает 2026 tech-updates (opendataloader-pdf, VoxCPM2, chrome-devto
